| Action | MMA | MACD_MME | Bollinger | Stochastique | RSI | Chandelier |
|---|---|---|---|---|---|---|
| AMUNDI EURO STOXX 50 UCITS ETF-C EUR | RAS | RAS | RAS | Neutre | Signal ↑↑↑ : 15.6% | Neutre | RAS |
AMUNDI EURO STOXX 50 UCITS ETF-C EUR : 168.82
| 1j | 5j | 1m | 3m | 1a |
|---|---|---|---|---|
| 0.69% | 1.87% | 7.89% | 14.19% | 23.66% |
Evolution annuelle
Min : 134.68Moy : 150Max : 168.82
|
168.82
| Court terme | Moyen terme | Long terme |
|---|---|---|
 | | |

Analyse Boursicot du 17/06/2026
Graphique boursier
 Bollinger
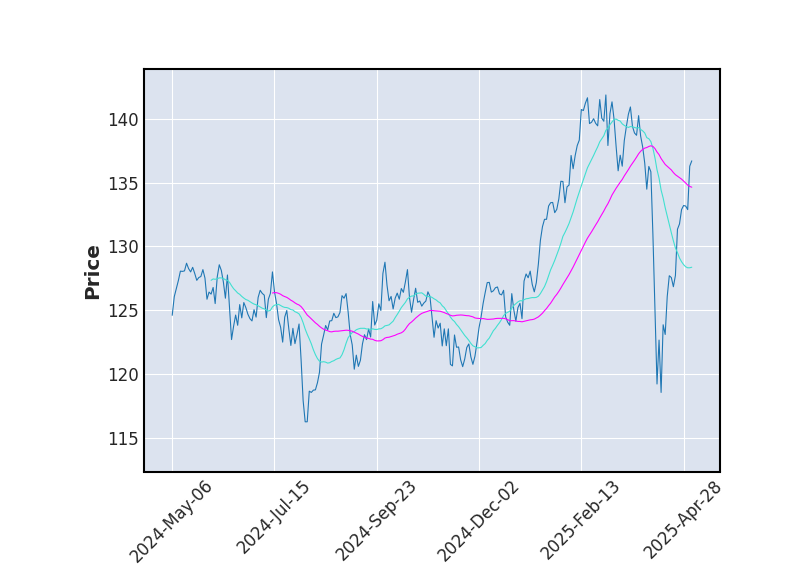 Moyenne Mobile
 Stochastique
 RSI
RSISTOCHASTIQUE
Le stochastique (%K) vient de croiser son signal (%D), une hausse devrait se produire sur le titre (à valider par un indicateur secondaire).
VOLUME
Nous constatons plus de 50% d'échange de plus que d'habitude sur le titre.
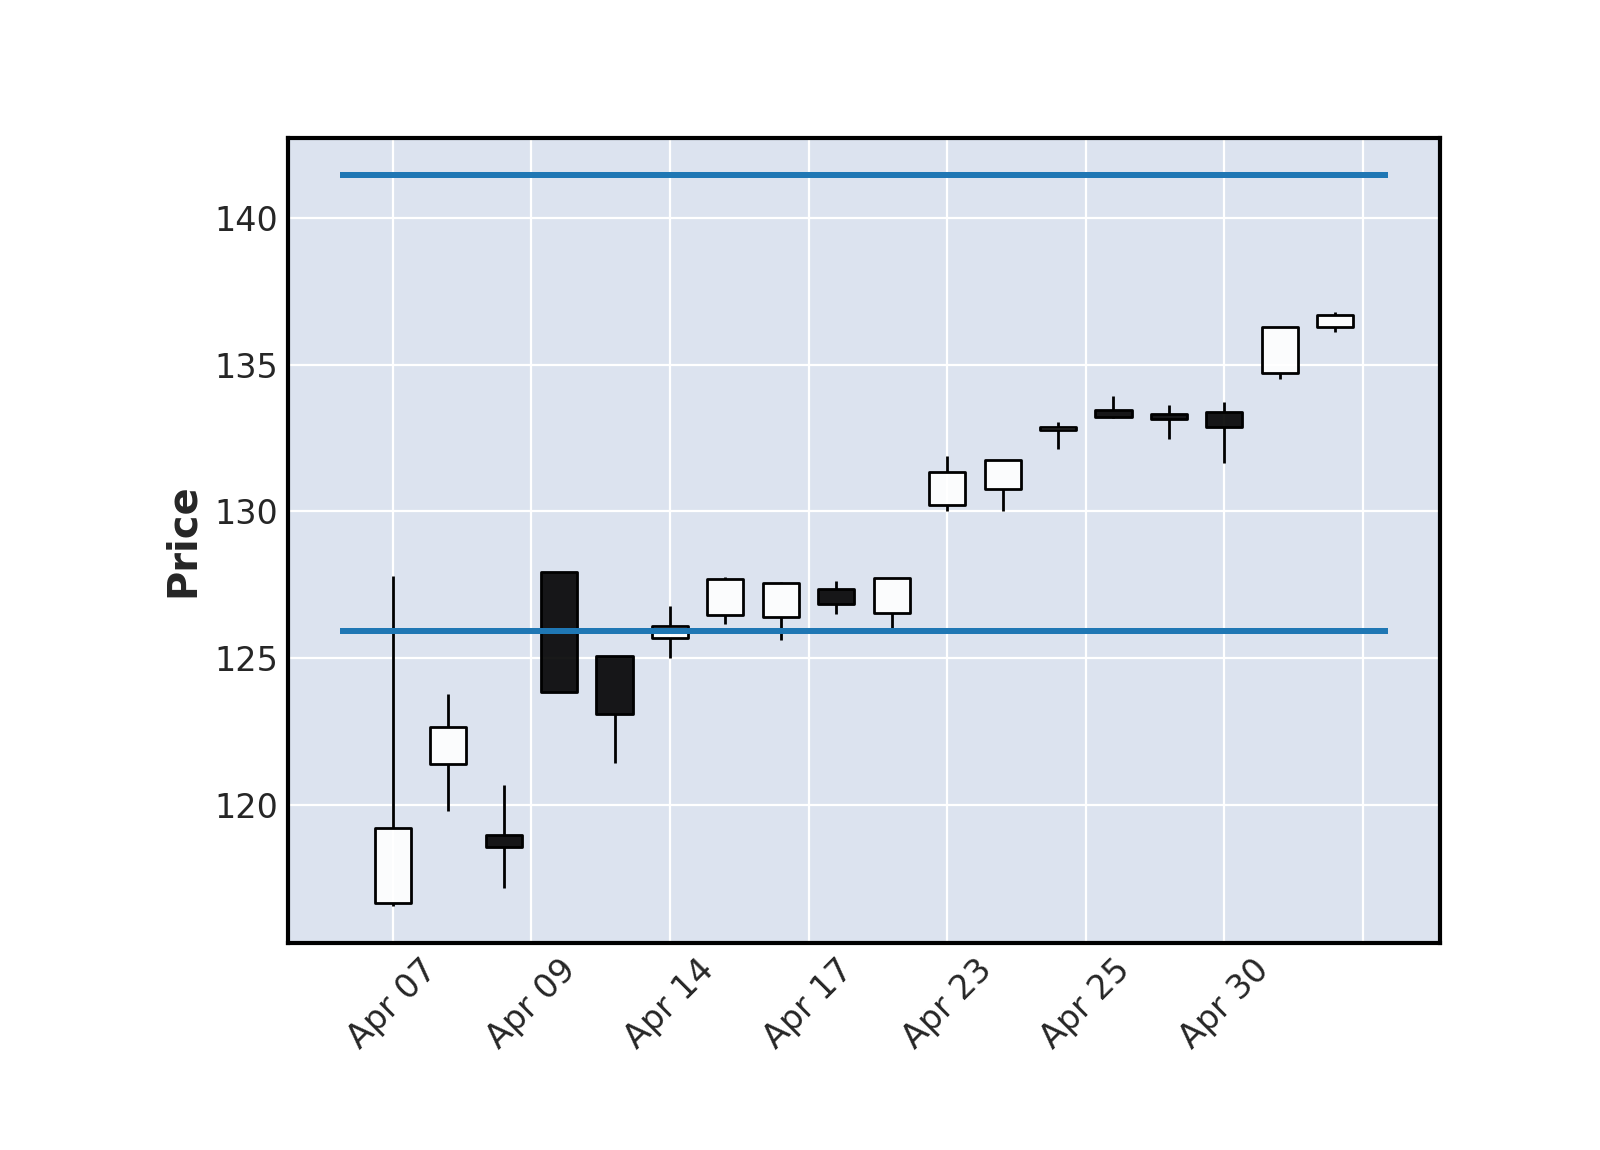
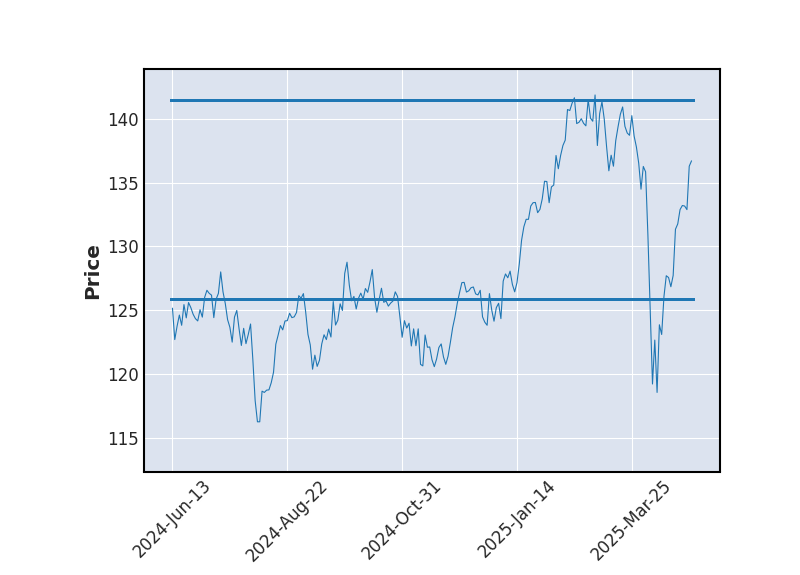
SUPPORTS ET RESISTANCES
| Support Résistance | Rebond | Ecart avec le cours |
|---|---|---|
| 160.91 | 10 | -4.69% |
| 154.78 | 3 | -8.32% |
| 148.99 | 4 | -11.74% |
| 143.53 | 7 | -14.98% |
Historique de cours - AMUNDI EURO STOXX 50 UCITS ETF-C EUR
Positionnement boursier de AMUNDI EURO STOXX 50 UCITS ETF-C EUR


Version Beta