| Action | MMA | MACD_MME | Bollinger | Stochastique | RSI | Chandelier |
|---|---|---|---|---|---|---|
| AMUNDI MSCI EM ASIA UCITS ETF-C EUR | RAS | RAS | RAS | Neutre | Signal ↑↑ : 18.57% | Neutre | RAS |
AMUNDI MSCI EM ASIA UCITS ETF-C EUR : 60.79
| 1j | 5j | 1m | 3m | 1a |
|---|---|---|---|---|
| 1.6% | 3.38% | 11.21% | 25.89% | 57.81% |
Evolution annuelle
Min : 38.46Moy : 46.85Max : 61.43
|
60.79
| Court terme | Moyen terme | Long terme |
|---|---|---|
 | | |

Analyse Boursicot du 17/06/2026
Graphique boursier
 Bollinger
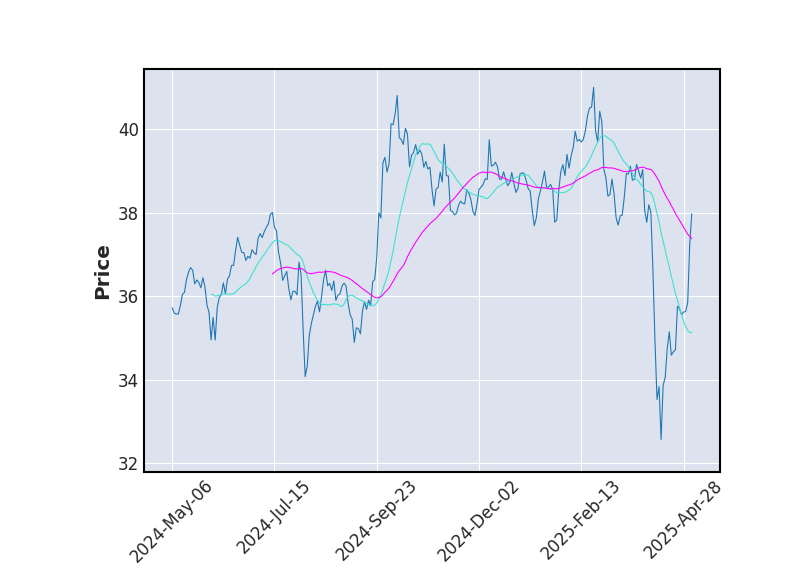 Moyenne Mobile
 Stochastique
 RSI
RSISTOCHASTIQUE
Le stochastique (%K) vient de croiser son signal (%D), une hausse devrait se produire sur le titre (à valider par un indicateur secondaire).
SUPPORTS ET RESISTANCES
| Support Résistance | Rebond | Ecart avec le cours |
|---|---|---|
| 47.75 | 3 | -21.44% |
| 44.62 | 4 | -26.59% |
| 43.39 | 3 | -28.63% |
| 40.87 | 5 | -32.77% |
Historique de cours - AMUNDI MSCI EM ASIA UCITS ETF-C EUR


Positionnement boursier de AMUNDI MSCI EM ASIA UCITS ETF-C EUR


Version Beta