| Action | MMA | MACD_MME | Bollinger | Stochastique | RSI | Chandelier |
|---|---|---|---|---|---|---|
| SARTORIUS STEDIM BIOTECH | RAS | RAS | RAS | Neutre | RAS | Neutre | RAS |
SARTORIUS STEDIM BIOTECH : 166.7
| 1j | 5j | 1m | 3m | 1a |
|---|---|---|---|---|
| -2% | -2.63% | -7.49% | 2.65% | -1.88% |
Evolution annuelle
Min : 150Moy : 183.2Max : 224
|
166.7
| Court terme | Moyen terme | Long terme |
|---|---|---|
 | | |

Analyse Boursicot du 31/07/2026
Graphique boursier
 Bollinger
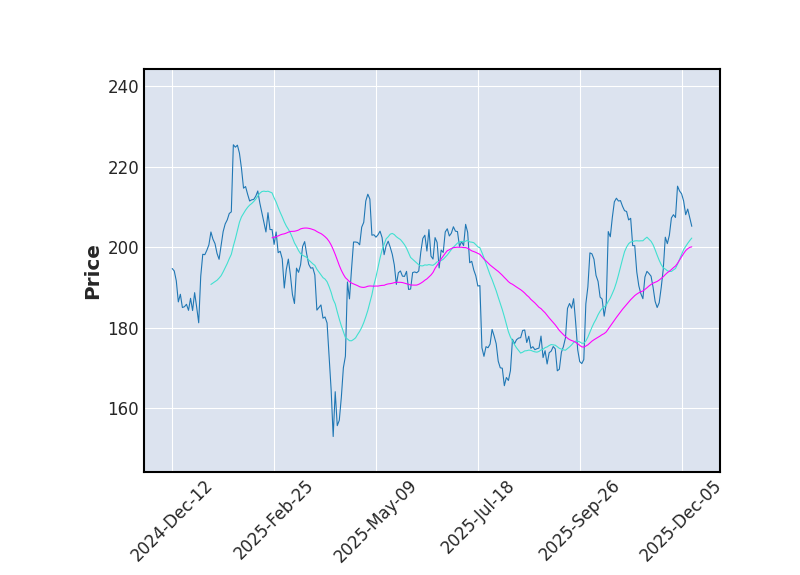 Moyenne Mobile
 Stochastique
 RSI
RSIL'analyse du cours ne permet pas de déterminer de tendance claire.
VOLUME
Nous constatons plus de 50% d'échange de plus que d'habitude sur le titre.
SUPPORTS ET RESISTANCES
| Support Résistance | Rebond | Ecart avec le cours |
|---|---|---|
| 187.7 | 4 | 12.6% |
| 182.94 | 5 | 9.74% |
| 167.7 | 3 | 0.6% |
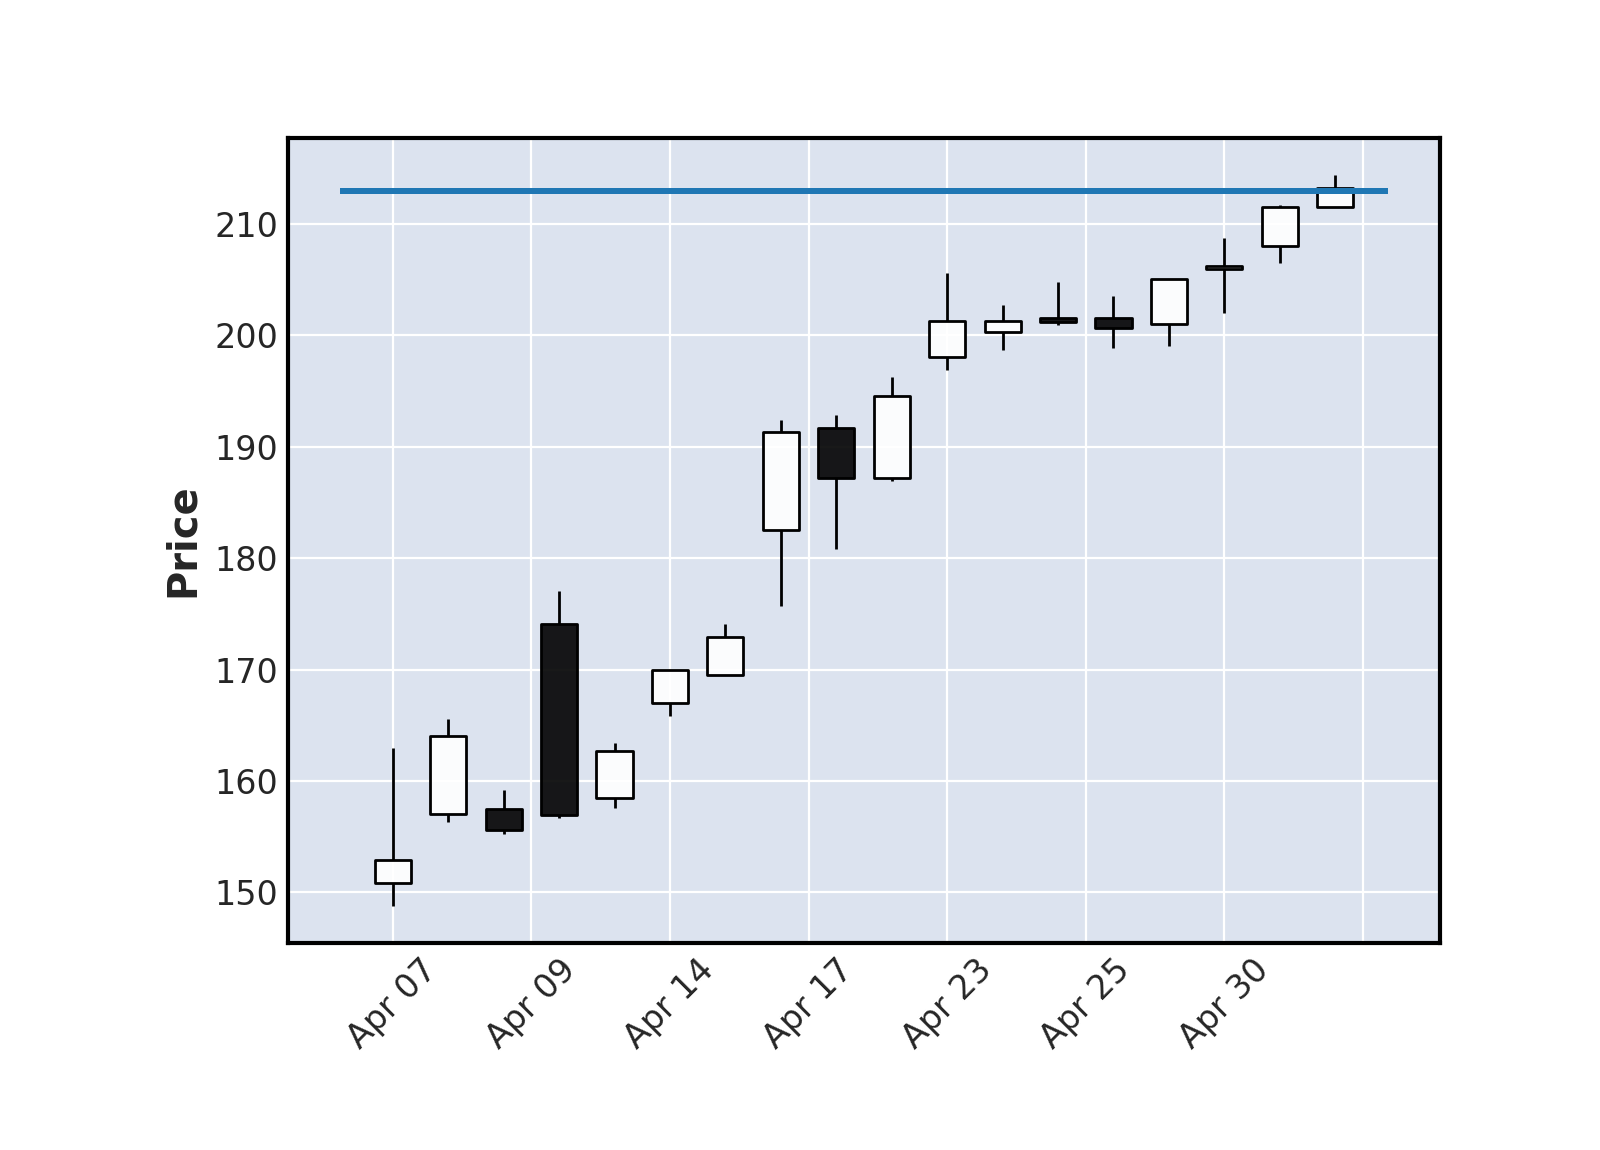
Historique de cours - SARTORIUS STEDIM BIOTECH
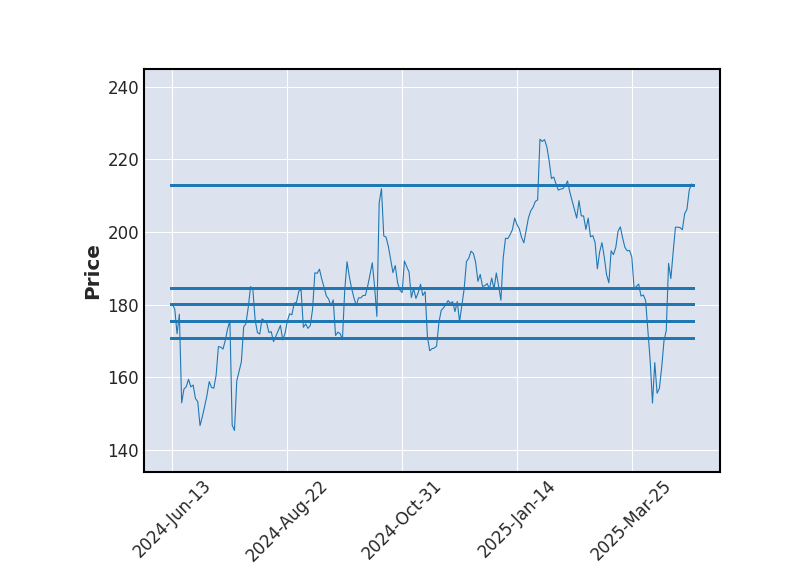
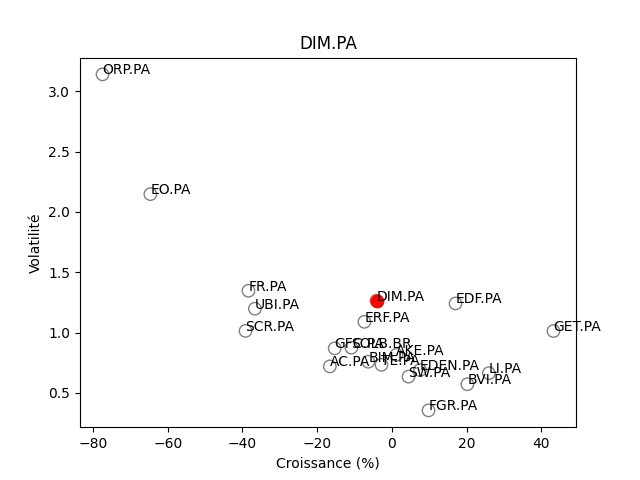
Positionnement boursier de SARTORIUS STEDIM BIOTECH

Version Beta