| Action | MMA | MACD_MME | Bollinger | Stochastique | RSI | Chandelier |
|---|---|---|---|---|---|---|
| ARKEMA | RAS | RAS | ↓ | Neutre | RAS | Sur-achat↓ | RAS |
ARKEMA : 58.9
| 1j | 5j | 1m | 3m | 1a |
|---|---|---|---|---|
| -3.6% | 1.46% | 4.06% | -5.91% | 0.43% |
Evolution annuelle
Min : 48.3Moy : 56.36Max : 67.05
|
58.9
| Court terme | Moyen terme | Long terme |
|---|---|---|
 |  | |

Analyse Boursicot du 31/07/2026
Graphique boursier
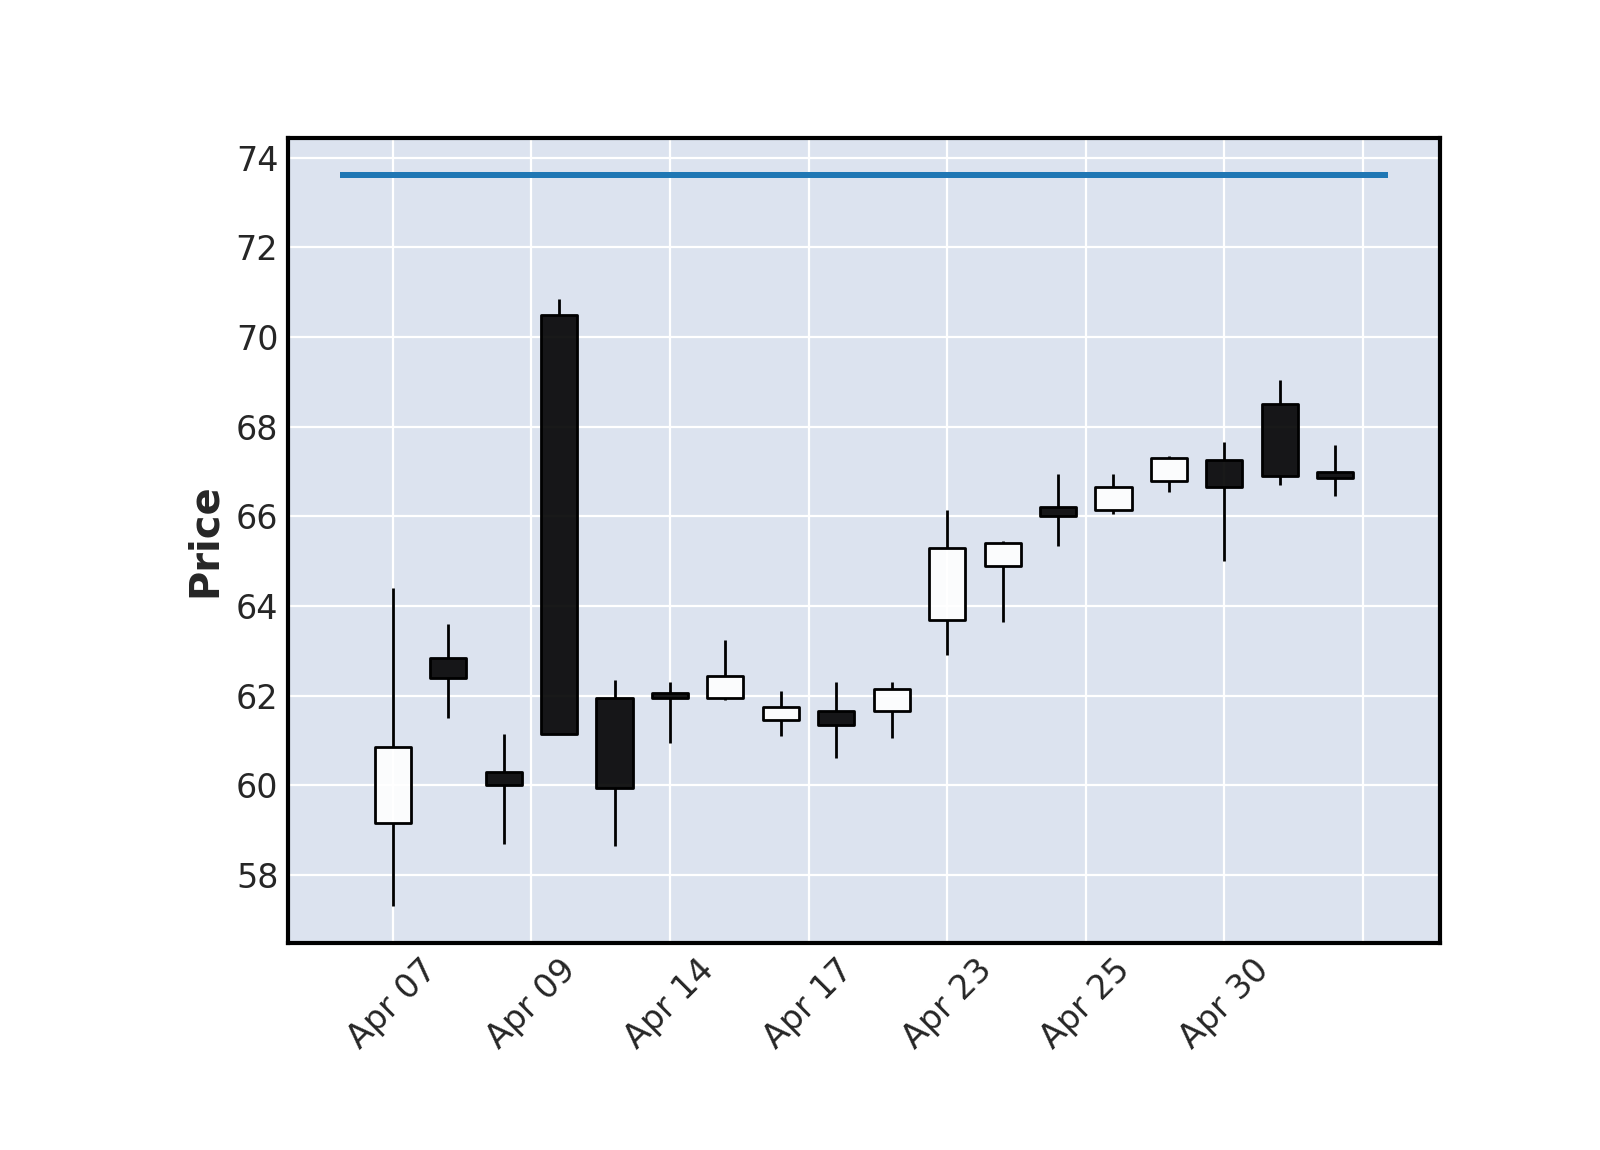
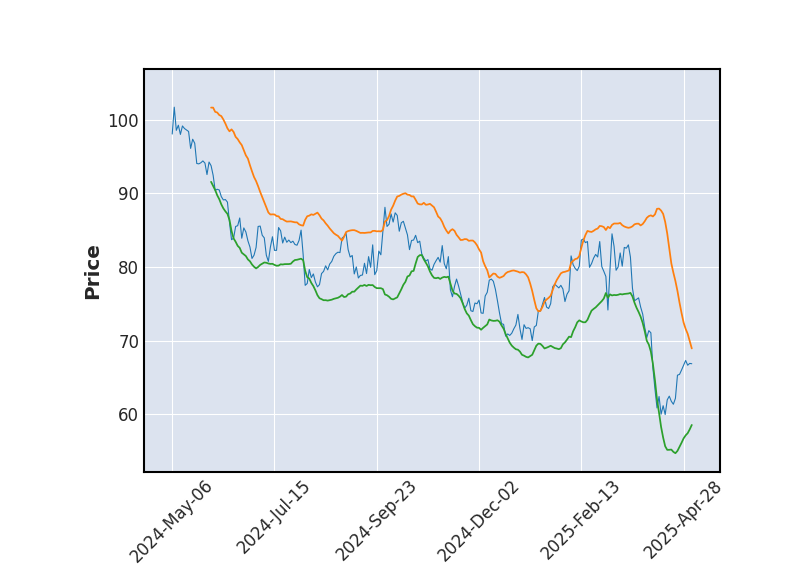 Bollinger
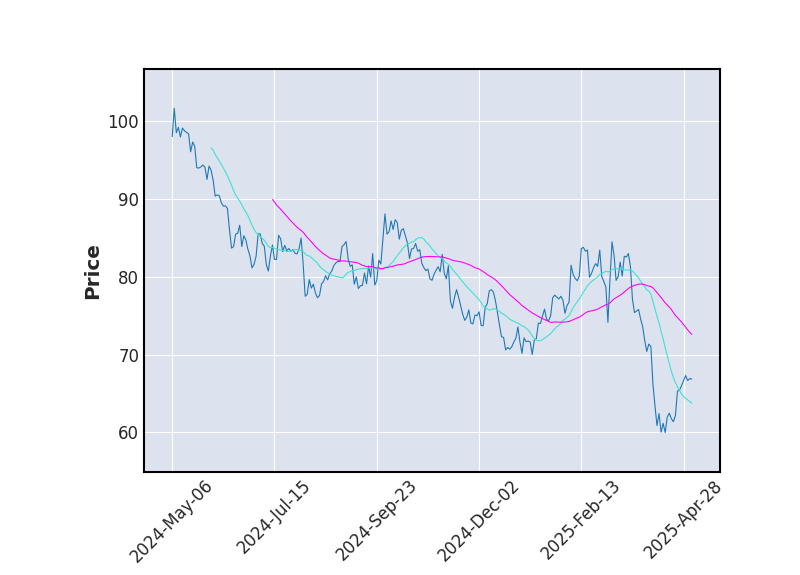 Moyenne Mobile
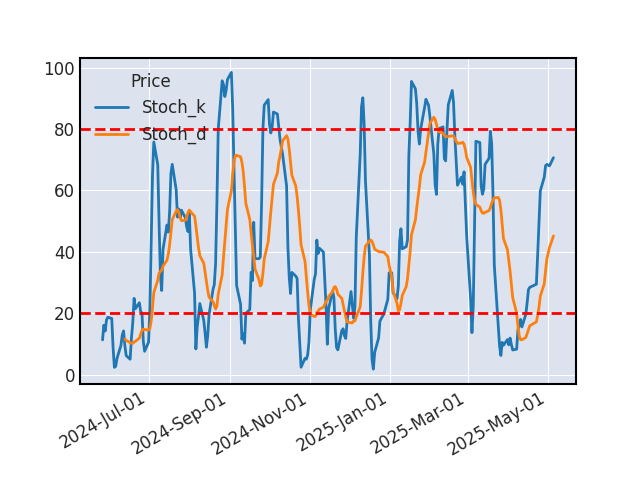 Stochastique
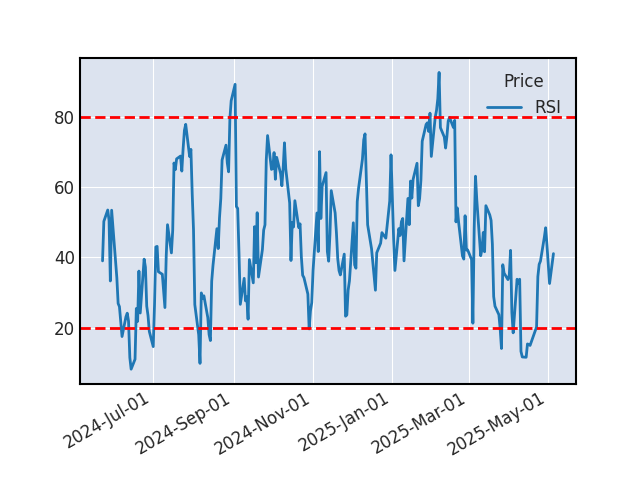 RSI
RSIBOLLINGER
Suite au retour du cours dans les bandes de Bollinger, une baisse du cours est attendu.
RSI
Le RSI vient de sortir de la zone de sur-achat indiquant une baisse à venir sur le titre ARKEMA.
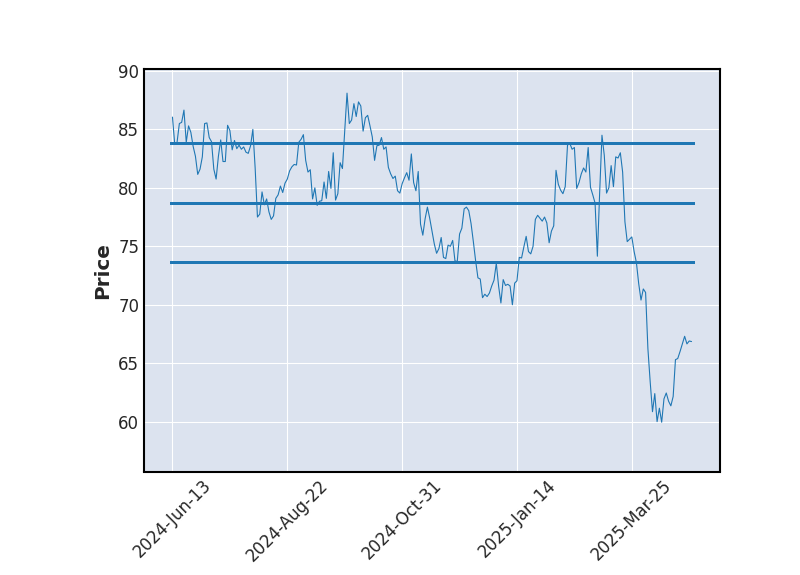
SUPPORTS ET RESISTANCES
| Support Résistance | Rebond | Ecart avec le cours |
|---|---|---|
| 65.32 | 2 | 10.91% |
| 61.87 | 4 | 5.04% |
| 59.17 | 4 | 0.45% |
| 57.15 | 3 | -2.97% |
| 53.57 | 8 | -9.05% |
| 52.18 | 3 | -11.42% |
| 50.42 | 3 | -14.39% |
| 49.13 | 3 | -16.59% |
Historique de cours - ARKEMA
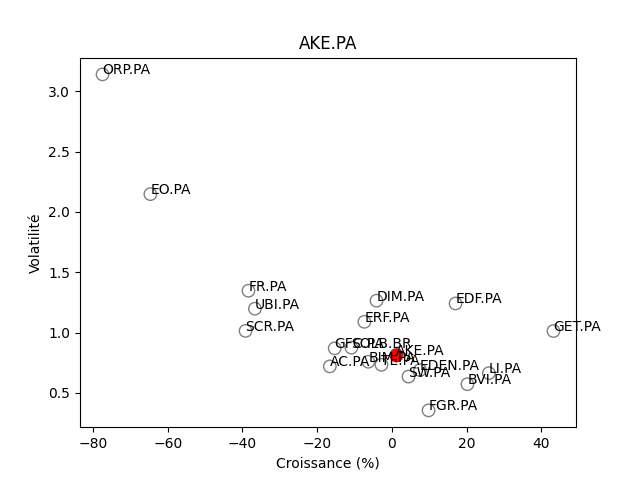
Positionnement boursier de ARKEMA

Version Beta